Meta Just Showed Us The Receipt
· Articles
Meta reported Q1.
Wall Street ran straight to the capex line. Full-year guidance climbed by 10 billion dollars. The stock dropped 6.8 percent in the first hour.
Headlines wrote themselves.
The number that mattered for the people actually buying ads was buried two paragraphs into the release.
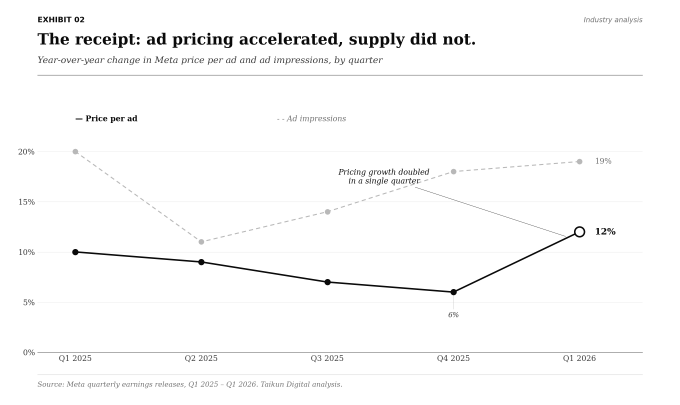
Average price per ad climbed +12% YoY.
The quarter before, it was +6%.
In a single quarter, the rate of price growth doubled.
If you have felt your CPMs climbing in 2026 and wondered if your media buyer was losing the plot, the receipt is now official. The platform got more expensive faster.
The numbers look like a beat
Understand the scale first.
Q1 2026 revenue was $56.31B. Up 33% percent YoY. The fastest growth quarter since 2021.
Net income $26.77B.
Operating margin held at 41%.
Family daily active people reached 3.56B.
EPS came in at 10.44, well above the 6.72 estimate. Strip out the $8.03B tax benefit tied to a Treasury notice and adjusted EPS is 7.31.
Still a clean beat.
Ad impressions climbed 19% YoY. The quarter before they were up 18%. Inventory has been consistent for four straight quarters (that's a problem).
Price did something else.
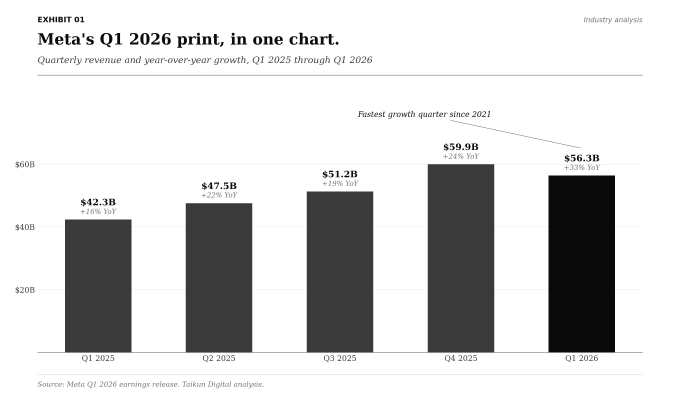
Q1 2025 saw price growth around 10%. Q2 was 9%. Q3 was 7%. Q4 was 6%. The line was decelerating quarter after quarter.
Then in Q1 2026, we get it snapped back to 12%.
The platform did not slowly drift more expensive.
It re-priced... For AI.
Your receipt is in the gap between two lines
The chart that matters is the divergence.
For five straight quarters, ad impressions have grown in a tight band.
11%t on the low end. 20% on the high end.
Meta has been working the margins of inventory for years. More video. Longer sessions. Deeper retention. The order of magnitude has not changed.
But... price moved on a different track.
Sit with what that gap means for businesses...
A 12% in price against a 19% rise in impressions on low user growth, is not the relationship that you want for growth. The platform did not get 19% bigger. The auction got 12% more competitive on top of inventory that grew at roughly the same rate it always does.
Now translate that into account-level reality.
To deliver the same number of unique people, frequency has to climb. To keep CAC flat at higher CPM, conversion rate has to climb to make up the gap.
Neither happens by itself.
Neither happens by itself.
Both require more work, more spend, or both.
Most accounts get neither.
The math compounds quietly.
CPM rises. Frequency rises with it because budgets defending CAC chase the same audiences harder.
The cost to reach a thousand unique people, the metric that @PhilKiel calls CPMr, climbs faster than either input on its own.
Two variables. Both moving the wrong direction. Multiplied.
Q1 2026 is what that compounding looks like at platform level for the first time. We have been watching it at account level all quarter.
We have no ego here but CPMr saw it first.
The +12% is not news to us.
We finished a structural audit at the end of Q1 2026.
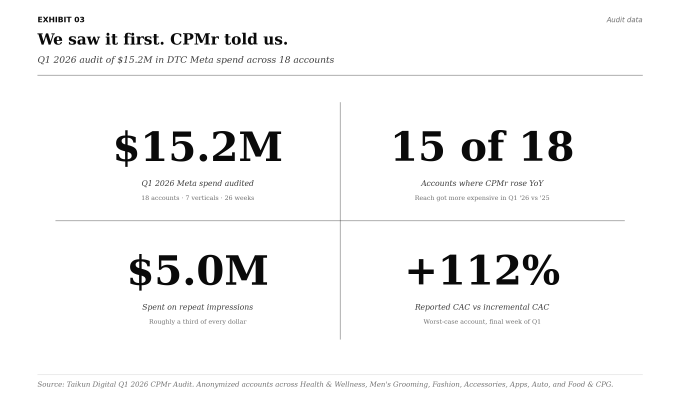
Eighteen DTC Meta accounts, seven verticals, $15.2M dollars in spend, twenty six weeks of weekly data on a tool for audits that we've been testing.
The metric we tracked across the audits was CPMr.
Reach got more expensive in 83% of those accounts compared to Q1 2025.
In 5 accounts, every comparable week of Q1 2026 was worse than 2025.
CAC stayed quiet through most of it.
That last line is what matters to us.
Reported CAC is a lagging indicator.
By the time the dashboard catches up to what is happening in the auction, the quarter is already closed.
CPMr catches the bleed first.
There is a diagnostic in CPMr that nothing else gives you.
CPMr can rise for two completely different reasons.
The auction itself getting more expensive, which is what Meta just confirmed at platform level. Or showing the same person the same ad more often, which is what happens inside an account when audiences saturate.
The first one usually doesn't hurt CAC.
The second one always does.
Two cases from the audits we did using our new tool, anonymized.
MG-1, a men's grooming brand:
Cost to reach a new person rose 76% YoY.
Almost entirely because the same audience kept seeing the same ads.
CAC nearly doubled. By the last week of Q1, the reported CAC of $163.
The estimated cost to acquire a new customer who actually needed convincing was closer to $345.
A 112% gap between the comfortable number and the real one.
HW-4, a GLP-1 brand:
Started Q1 with the same person seeing the ads roughly 6 times on average. By the end of the quarter, that was down to 4.5.
Spend went up 14%. Reach went up 40%.
CPMr dropped 22%. CAC dropped almost in half (-46%).
Same Meta.
Same +12% auction pressure.
Different operating decisions inside the account. Different outcomes.
Across the full audit (which you can read here), $5M out of $15.2M went to people who had already seen the ads at least twice.
About a third of every dollar spent on Meta in Q1 2026 was funding repeat impressions to people who already knew the brand.
The brands that beat their Q1 CAC didn't beat the auction. The auction beat everyone. They reduced frequency.
This is why we keep harping on CPMr.
The +12% Meta reported in earnings tells you the auction half of the story.
Whether the +12% wrecks your account is decided inside your account. By how much frequency you let stack on the people who already know you.
Most operators check three numbers. All three describe yesterday.
CPMr is the one that describes what your account is about to do next.
The audience no Meta budget can reach
There is one assumption that lives inside every Meta budget conversation.
That paying more on Meta is the only way to reach more Americans.
The data has been quietly invalidating that for years.
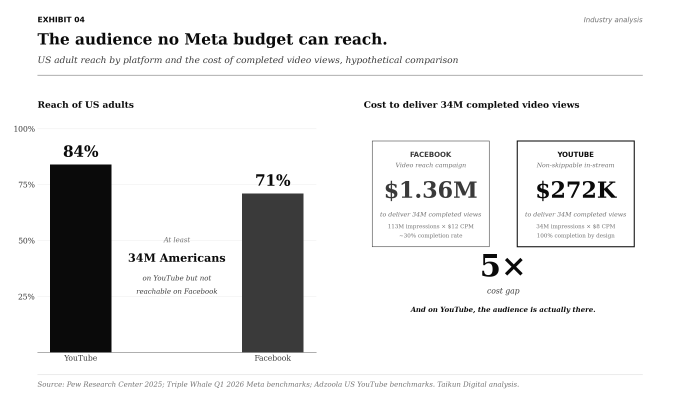
84% use YouTube. 71% use Facebook.
The math on those two numbers is simple.
The remainder is YouTube-only users at minimum.
At least 13% of US adults use YouTube but not Facebook.
In a country of roughly 263M adults, that is at least 34M Americans.
(our napkin math if you will)
The 34M is the conservative floor, and that floor assumes every single Facebook user also uses YouTube.
The real number is almost certainly higher.
These are not edge cases. Not a niche. Not a targeting problem you have not solved yet. They are simply not on Meta.
No targeting iteration, no budget increase, no creative refresh, no Advantage+ optimization closes that gap.
The audience is structurally off the platform.
Now layer on the cost picture.
Meta video reach campaigns ran roughly $12 CPMs in Q1 2026 (benchmark across DTC accounts).
YouTube non-skippable in-stream ran closer to $8 on average.
Before the +12% Q1 jump on Meta ad costs, YouTube was cheaper per impression. After it, the gap is wider than a quarter ago.
Run the math on a hypothetical.
Suppose Meta could reach those 34M users, which it cannot. To deliver 34M completed video views on Facebook at a 30% average completion rate, you would need 113M impressions.
At $12 CPMs, that is $1.36M.
On YouTube non-skippable, completion is 100 percent by design.
To deliver the same 34M completed views, you need 34M impressions.
At $8 CPMs, that is $272k .
A 5x cost gap.
And on YouTube, those 34M are actually there.
The point is not that Meta has no value.
Meta is the best conversion engine in advertising and remains so.
The point is that every Q1 2026 budget conversation about why CPMs are higher needs a second question alongside it.
What does this budget not buy us?
I didn't include this to sell a service. I included it to encourage you to answer that question:
What does your H2 budget actually buy you?
Why the price line moved when it did
Inventory on Meta is finite.
The feed is a feed. Reels are reels.
There are only so many slots a user sees before the phone goes back in the pocket. Impression growth has run between 11-20% for five straight quarters because that is the natural ceiling on the work Meta can do to expand inventory inside its own products.
Demand is something else.
Advantage+ is finding buyers more efficiently. Creative ranking is rewarding the right ads faster. Brands seeing returns on Meta in 2026 are bidding harder because the platform is paying out. Word travels. More advertisers join the auction. The auction gets more expensive for everyone in it.
aka. Auction-level explanation.
Underneath it sits a structural one that nobody on the buyer side voted on.
Wall Street is not evaluating Meta's AI spending the way it evaluated the metaverse.
There is no "when will this pay off" patience.
Analysts have settled on one number that decides whether $125-145B in 2026 capex was justified...
Insert: Average price per ad.
Investing.com flagged it in January. Average price per ad acceleration was the clearest proof that Meta's AI investment would deliver.
24/7 Wall Street built its $2T bull case for Meta in April on the same logic.
Capital spending converts into higher ad prices.
Stoxcraft framed the Q1 report as: "Can the ad machine fund a $125B annual AI build?"
The flywheel is now on the record.
AI capex goes in → "Better" ad products come out → Better by Meta's measurements, on Meta's dashboards, sold to advertisers as a premium worth paying → Advertisers pay the premium → The premium funds the next round of capex
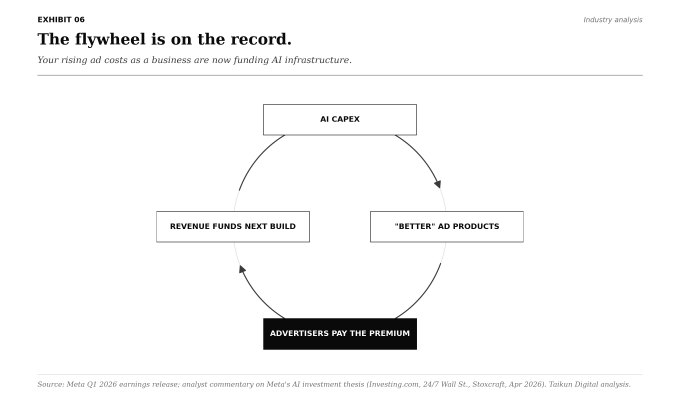
Q1 2026 is the first time where the flywheel showed up in the numbers.
The +12% on price is not a side effect. It is the thesis paying out.
Q4 2025 was Meta pricing in a normal post-holiday quarter.
Q1 2026 is Meta pricing in the AI cycle.
The supply did not change. The price did.
Every brand on the platform is paying for AI infrastructure they did not order. The investors are betting it works.
The advertisers like us are funding it either way.
Capex tells you where this is going
Meta raised full-year capex guidance by $10B on both ends.
The original range, set in January, was $115-135B.
The revised range is $125-145B.
CFO Susan Li attributed the bump to higher component pricing and additional data center costs to support future capacity (you will fund that).
Q1 capex came in at $19.84B. Below estimates of $27.57B.
The back half of 2026 is loaded...
While they were adding $10B in capex, they ran through 8,000 layoffs. About 10% of headcount. Plus 6,000 open roles closed. That follows 1,000 cuts in Reality Labs in January and a few hundred more in March across Facebook, operations, and sales.
From what we can see... the pattern is no longer subtle.
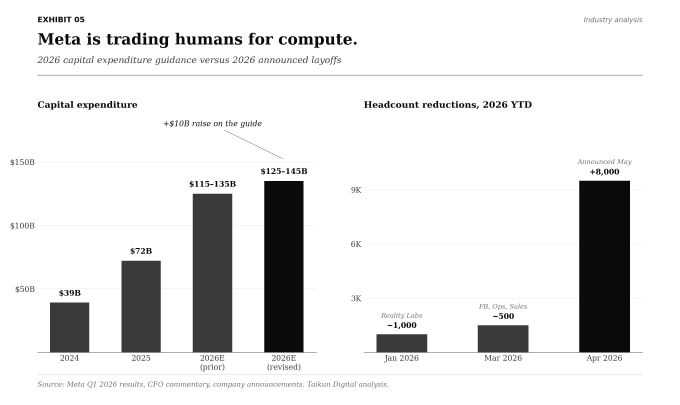
Meta is trading humans for computers.
The computer powers the ad engine we love/hate that just delivered 12% pricing growth.
The bet is the bet.
And... the bet is being funded by all of us running campaigns.
The reckoning
Meta will not slow down in 2026.
Q2 revenue guidance came in at $58-61B.
The midpoint implies another acceleration off Q1.
Capex is rising and so will ad costs.
The brands compounding on Meta this year will most likely be the ones who watch CPMr instead of waiting for CAC to catch up.
Less frequency stacked on the same audience.
More creative volume.
Better measurement of what the spend is actually delivering.
Less time spent litigating CPMs that the platform itself just told you are structurally moving up.
The brands truly growing are the ones who also remember that Meta is one input in a P&L, not the whole field.
They have a plan for the audience Meta cannot reach.
They have a plan for the formats Meta does not run.
They are not loyal to a platform.
The ones who do neither will be writing the same email to their agency in October that they wrote in March.
"Why are our CPMs so high?"
The receipt has been printed.
Sources: Meta Q1 2026 earnings release (April 29, 2026), Meta Q4 2025 earnings release (January 28, 2026), Meta Q1 through Q4 2025 quarterly press releases, CFO outlook commentary, CNBC, Variety, Stocktitan, GuruFocus, 24/7 Wall St., Alphastreet, Yahoo Finance / Investing.com, Stoxcraft, EBC Financial Group, Pew Research Center, Americans' Social Media Use 2025 (November 2025 release, n=5,022), Triple Whale Q1 2026 Meta benchmarks across 18 industries, Adzoola US YouTube CPM analysis on 14.3B in spend, US Census Bureau Vintage estimates, Taikun Digital Q1 2026 CPMr Audit